Troubleshoot Connection Center
If you're having trouble with Connection Center our troubleshooting steps can help you work out what is going wrong. They are loosely in an order you would look to approach a problem with, however not all steps are relevant to all problems.
Below this, is the specific issues section. This contains a number of issues or quirks that we have encountered and felt were worth calling out directly. Not all of these have resolutions, and can just be quirks of SCOM.
This page is focused on SCOM. If you are looking for troubleshooting steps related to a specific destination, you can find these in the child pages of this article.
- Troubleshooting in ServiceNow
- Troubleshooting Cherwell
- Troubleshooting Webhooks
- Troubleshooting Object Connections
- Troubleshooting ServiceNow Object Connections
Troubleshooting Steps
1. Connection UI
Connection Center comes with a UI for each of the different connection types, showing you the properties and state of each connection.
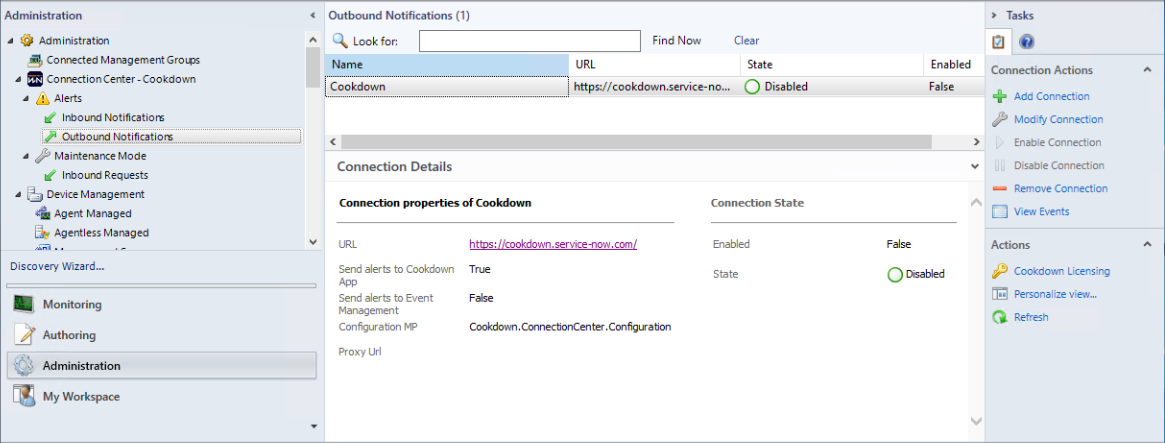
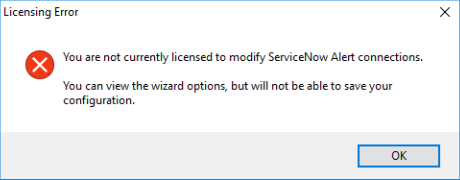
In the example image above there are a couple of key things. The state of the connection is shown as Disabled and there is no option to Enable the connection. In this scenario, you should attempt to modify the connection at which point we are shown that the license has expired:
If the connection is showing an error state it would be worth checking over the properties to make sure that these are set up correctly. Common issues include:
Typos in the URL (which can be clicked on to verify it is correct)
Choosing the incorrect App configuration
Check with your ServiceNow admin whether you should be using the Cookdown App or Event Management
Check with your Cherwell admin that you are using correct Incident values
2. View Test Events
Each connection will attempt to run Connection tests periodically and these will generate events that can be looked at via the UI.
In the case of REST API-based connections (such as ServiceNow or Cherwell), these tests happen on startup. For webhook-based connections (such as Slack or Microsoft Teams), these checks occur the first time an alert is sent via the connection.
Selecting the connection in the UI and then selecting 'View Events' will show you all of the recent events for the connection type. Any recent errors (such as those shown in the examples below) should be investigated.
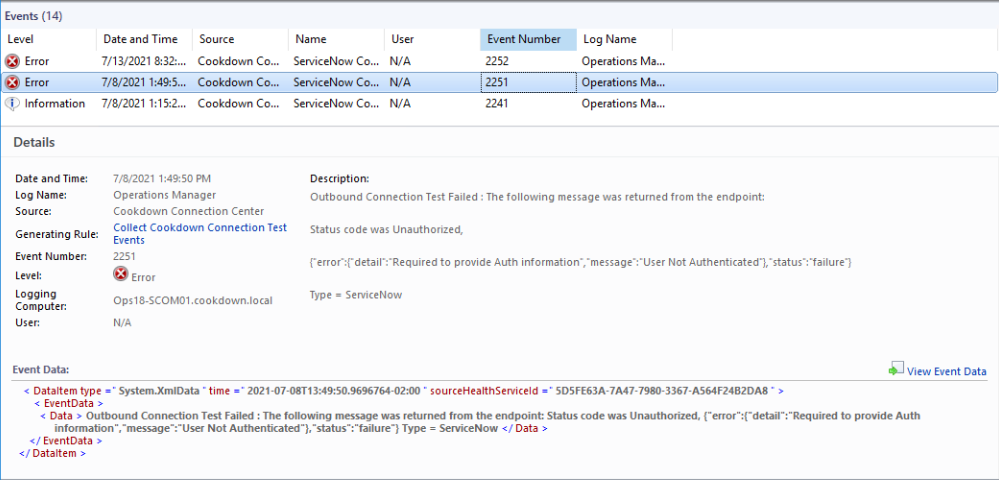
Incorrect or absent credentials can cause problems connecting, resulting in an error.
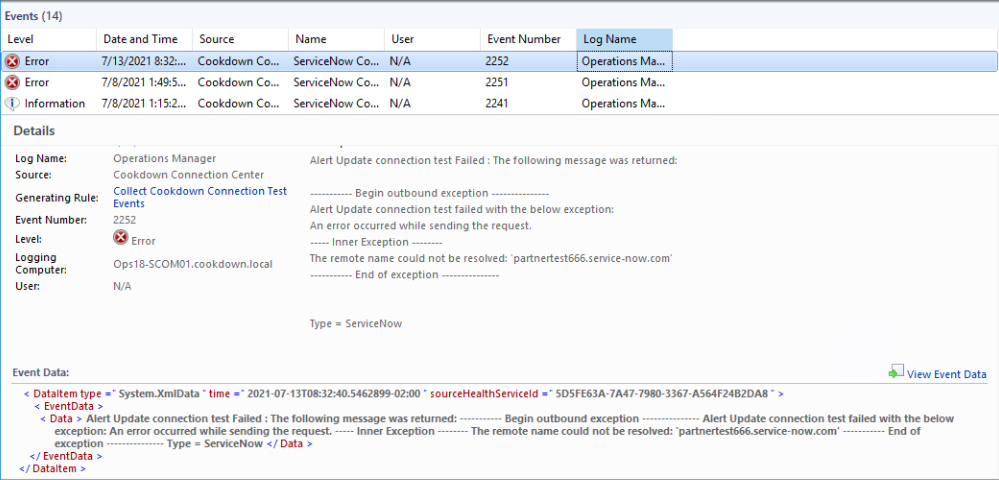
Typos in the URL can also result in connection errors.
The event IDs across all connection types are structured to allow you to quickly narrow down your search to only those that matter at the time.
Event ID | Meaning |
|---|---|
224_ | The connection test has passed |
225_ | The connection test has failed |
22_1 | An Outbound Notification test |
22_2 | An Inbound Notification test |
22_3 | An Inbound Maintenance test |
So using the examples above we see that the 1st event is a failure on an Outbound Notification test (2251) and in the 2nd event, we have a failure on an Inbound Notification test (2252).
Note that this view will only show you test events. Successes/Failures that occur outside of these scenarios will not be shown in this view.
These are SCOM events and are subject to your grooming settings. You may find that the 'View events' view is empty if a connection test has not occurred within this time period. You may still be able to view these events on the management server in question or via Log aggregation tools if you employ them.
3. Check for Connection Alerts
When a connection fails, by default, an alert is raised to notify you of the occurrence. This will be a warning alert and the source will be for the ‘Connection Hub' of the destination type in question. In the following example, this is the 'ServiceNow Connection Hub’.

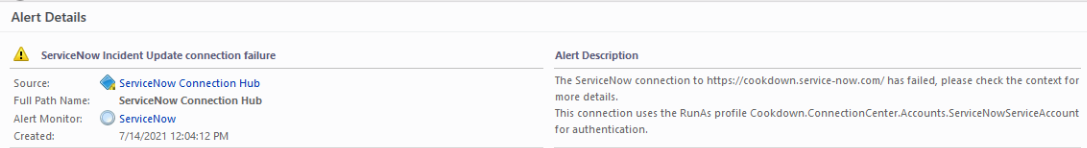
Viewing the alert properties and 'Alert Context' in particular can help shed some light on what is going on and can go into further detail than the connection tests.
3a. Check Runas Account/Profile
If you’re seeing authentication/authorization issues in the previous two steps, it is worth checking that your run-as accounts and profiles are configured and distributed correctly. Correlate the RunAs Profile in the alert with the correct Account. Ensure that the Account is distributed to the Management Server raised in the Test event. We have further guidance on this here.
If you are using a proxy, please check if this requires authentication. We have seen proxies throw 401 and 403 errors instead of 407 implying that this is an authentication issue on the target service and masking the real issue. If your proxy does require authentication we do have a proxy run-as profile that can be used to provide credentials.
4. Disable/Re-enable the Connection
If there have been repeated failures over a large period of time, SCOM can unload the module and stop it from re-loading. Disabling the connection, waiting for the configuration MP to be distributed, and then re-enabling the connection will reset this, allowing the connection to start working again (assuming the underlying problem is no longer present).
In high availability scenarios, this might also cause the process to be started upon a different management server. If you regularly see failure events from one server and not another there could be an environmental factor at play.
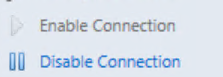
There are two ways to approach this.
By selecting the ‘Disable Connection’ option from the UI
By modifying the connection and turning the 'Connection is enabled' option off

Under the hood, these do behave slightly differently. The former preserves the current connection, the latter destroys it and then recreates it. For example, if you have an ITSM maintenance period where you temporarily want to stop generating incidents, you should use the Disable Connection option. Any alerts that are changed whilst the connection is disabled will be queued up and sent when the connection is re-enabled using the 'Enable Connection' option. On the other hand, if you have an alert storm in SCOM you may wish to modify the connection to change the state. This re-creates the connection effectively re-setting the queue. You could achieve the same behavior by using the Disable Connection link and then modifying the connection later to be enabled. Bear in mind that legitimate alerts may get thrown out with the unwanted alerts and that any manual customizations to the connection via the XML may also be removed.
5. View Health Explorer
The Health explorer can help narrow down the timings of state changes very quickly.
From the Monitoring Tab, select Discovered Inventory, followed by Change Target Type. From the list of all targets search for Cookdown to see all the available classes. If you are interested in one particular connection type, select the relevant connection hub. Otherwise, select 'Cookdown Connection Center Hub' to view all of the available connection types.
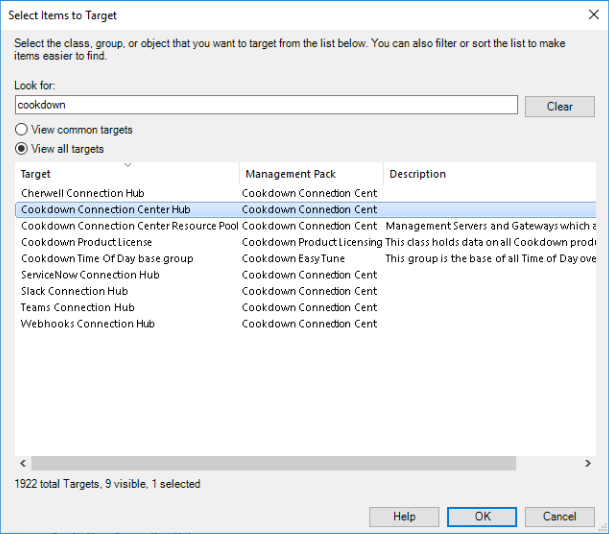
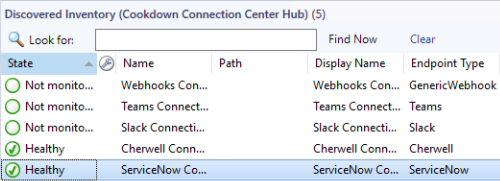
You should then be shown all of the available destinations
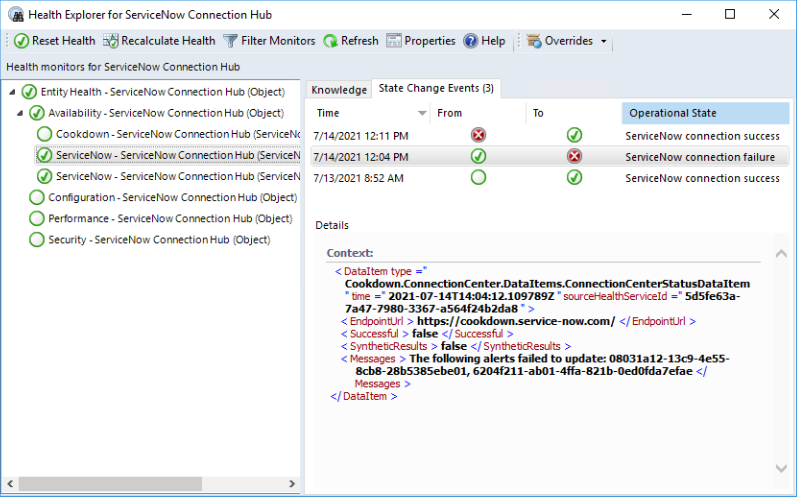
Select the destination you are interested in, followed by the 'Health Explorer'. By default, you will be shown any monitors in an error state, however, you can remove the monitor filter to see healthy monitors under the Availability monitor.
Select the monitor you are interested in and then select the 'State Change Events' tab to see what might have caused failures (or been affected by failures).
6. Check Alert History
If you are looking at an individual or small group of alerts you might want to check the ‘Alert History’ from the alert Properties. Connection Center will attempt to update each alert when it makes changes.
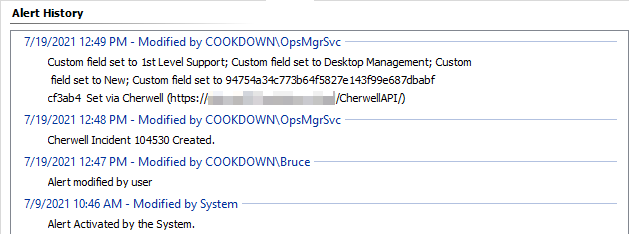
There are sometimes underlying issues that can prevent Connection Center from performing the expected tasks. For example, if an object is unavailable and in a 'grey state' the action to reset the monitor will fail. In this case, the history would still be updated to indicate that this has been attempted even if the task is not successful.
7. Find the active Management Server in the pool
From here we need to check out what is going on with individual members of the resource pool. For high availability purposes, there is usually a number of servers in the resource pool, however, only one server in the pool is ever doing the work assigned. If you have test events logged you should be able to work out what server is being used by the 'Logging Computer' property. If you have alerts raised for the connection, some of these alerts are raised against the health service of the management server doing the work. If this is the case you can use these names to narrow your focus. Failing that you can definitively determine the management server using the Operations Manager database with a SQL query adapted from this Catapult Systems blog article:
select
BaseManagedEntity.DisplayName
,cs.agent.AGentGuid
,cs.WorkFlowExecutionLocationAgent.AgentRowId
,cs.workflowexecutionlocation.WorkflowExecutionLocationRowId
,cs.workflowexecutionlocation.DisplayName
from cs.WorkFlowExecutionLocationAgent
inner join cs.workflowexecutionlocation
ON cs.WorkFlowExecutionLocationAgent.WorkFlowExecutionLocationAgentRowId = cs.workflowexecutionlocation.WorkflowExecutionLocationRowId
inner join CS.agent
ON CS.agent.AgentRowId=cs.WorkFlowExecutionLocationAgent.AgentRowId
inner join BaseManagedEntity
ON BaseManagedEntity.BaseManagedEntityId = CS.agent.AGentGuid
where cs.workflowexecutionlocation.DisplayName = 'Cookdown Connection Center Resource Pool'
Once you know which management server is handling your connections, you can usually narrow your focus to that server.
8. Check Event Log
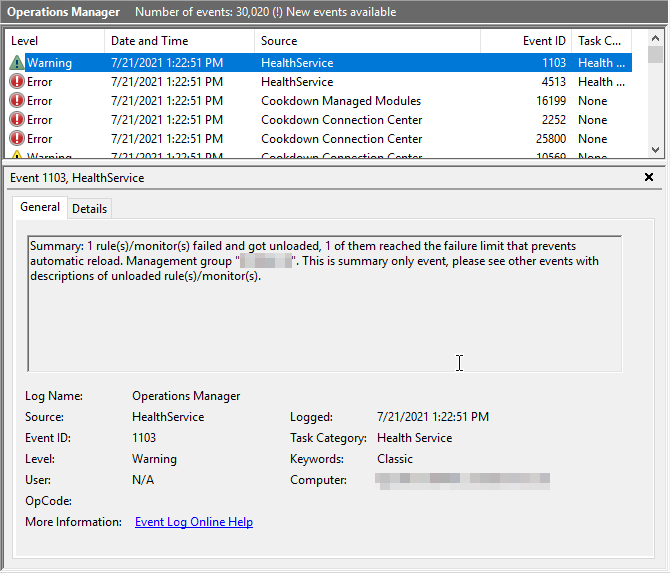
Connection Center will log out Warning and Error events to the Operations Manager event log as required. Generally, these will come from the ‘Cookdown Connection Center' and ‘Cookdown Managed Modules’ sources, but, you may find that there are events from other sources such as 'HealthService’ related to Connection Center in the runup or aftermath of these events. It can be worth filtering down to Cookdown Events to find rough timescales and then looking at that time period a bit more generally.
In our example to the right (event ID 4513 followed by 1103), you can see that a persistent network issue has caused SCOM to force Connection Center to abandon its reconnection attempts. Whilst not directly related to the root cause, it will compound the issue.
9. Restart the Health Service
In the previous example, we saw that SCOM can force our connection offline after too many failures. The easiest way to get the connection to reload in this scenario is to restart the health service of the management server looking after the connection. From PowerShell you can do this simply:
Get-Service -Name healthservice | Restart-Service
If you have Kevin Holmans SCOM Management MP you can do this via an agent task:
And of course, you could do this in person on the server by restarting the service from the Services List.
10. Try a Duplicate/Similar Connection
It can be worth re-creating the connection. This can help highlight any typos that might have crept into the initial connection.
In the case of complex alert criteria please try simpler criteria to test with and then build it up from there. Resolution states, for example, can cause issues if used in criteria as they can stop alert updates from being sent if they reach an unexpected state. We go into this particular scenario a bit deeper with some examples in our section about the difference between internal connectors and subscriptions.
11. Restrict Connection Center to a Single Management Server
In the case of intermittent issues or for debug logs it can be worth restricting the Connection Center Resource Pool down to a single server. This will ensure that you have all of your event logs in the same consistent location (especially useful in the case of debug logging). Rotating this pool through the servers manually should allow you to identify if a single server has an issue.
We have detailed instructions on how to achieve this here.
12. Flush the health service cache
A more extreme version of the health service restart. This forces the health service to completely unload its processes, clear out any cached information and restart. With Connection Center this can be useful if the connection has gotten itself into a strange state. For example, it may be hanging on to expired licenses or it may be trying to process something that it shouldn’t.
If you have Kevin Holmans SCOM Management MP you can do this via an agent task:
Otherwise you can do this from the Monitoring Menu:
Select OperationsManager > Management Server > Management Server State > Select Server from Management Server State.
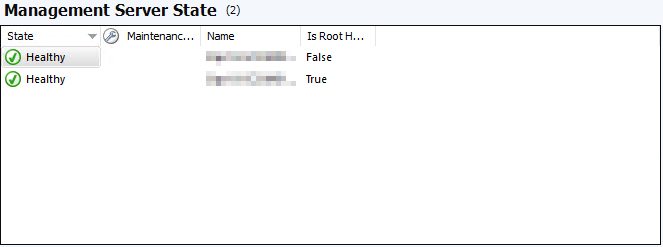
Finally, Select 'Flush Health Service State and Cache' from the task menu:

There are also options to do this manually (or via script) by stopping the health service, removing its health service state folder, and restarting the service. But this is outside the scope of this article and not something that we would necessarily recommend doing.
13. Manual Checks
Depending on the destination you may be able to do some manual checks using tools like Postman or PowerShell to validate some of the details you have been provided and your connection to the target endpoint. The specifics for how to check these details manually do vary by destination so largely this is covered under the subpages for each destination:
- Troubleshooting in ServiceNow
- Troubleshooting Cherwell
- Troubleshooting Webhooks
- Troubleshooting Object Connections
- Troubleshooting ServiceNow Object Connections
14. Enable Debug Logging
Enabling debug logging can be fairly intense on your management server depending on how busy it is. But this can give a lot more insight into what is going on. If you are going to do this we typically recommend that you do this server by server (using your resource pool) and that you increase the size of the Operations Manager log.
This may allow you to catch more specific errors or small details that can point you in the correct direction. Should you need to go down this route, we have further detail about the registry key and value here. If you’re at this stage it’s also probably worth talking to our support team by raising a ticket through the web portal or by emailing support@cookdown.com.
Specific Issues
There are some specific issues that may be encountered during the use of Connection Center or after upgrading from Alert Sync. The following may provide you with a direct solution or workaround.
Orphaned Internal Connectors
Problem
You created an Internal Connector in SCOM using Alert Sync and have removed this MP before cleaning up unused connectors. You may also have created a Connector-based connection in Connection Center using the Advanced UI option and run into a scenario where this has become orphaned.
Solution
Remove the duplicate/unused connector from the SCOM SDK. We have a simple Powershell script that will enable you to do this by following the below steps
Load Powershell
Download our Powershell script
Run script
Select the orphaned internal connector to remove and hit OK
Download Script
Incorrect Incident ID/Synced Data in SCOM if Instance Changed
Problem
After pointing a working Alert Sync connection at a different ServiceNow/Cherwell instance, my synced Incident data stored in SCOM from ServiceNow (such as Incident ID, Incident state, and Configuration Item) is incorrect.
Solution
As the Incident data on each SCOM alert is updated when something on the Incident changes, SCOM knows of no reason to update these fields. As alerts should be short-lived this will sort itself out over time, but the workaround for alerts that require updating is as below
Ensure you have an Inbound Notification Connection in SCOM pointing to the new instance
In SCOM, change the Resolution State of the alert to another state that would force an update to be pushed through your Outbound Notification Connection
If the required conditions are present, a new Incident will be created for the alert pushed to the new instance and updates will flow back to SCOM
Alerts Intermittently Sent from SCOM to ServiceNow when using Internal Connector
By default, Connection Center uses subscription connections which does not allow this condition to occur. We only recommend using Internal Connectors if you have a specific requirement that cannot be met by these subscriptions.
Problem
Alerts generated in SCOM appear to be sent/received by your destination intermittently. You forward alerts onto another system using another Internal Connector - this connector also sees the same issue.
In SCOMs Event Log you see Error 11501
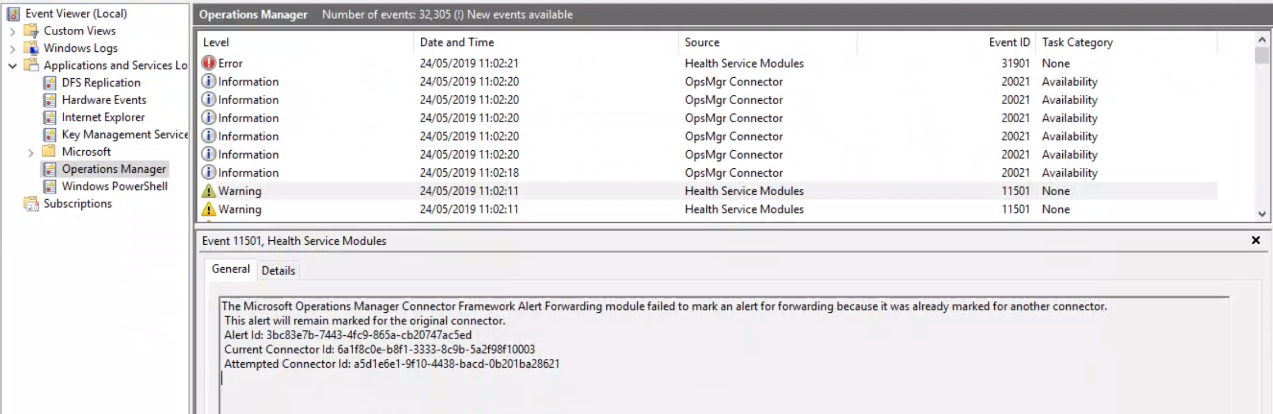
Cause
SCOM can associate an alert to one Internal Connector only due to an internal limitation. If you have two Internal Connectors set up to send alerts based on the same criteria, the alert will be sent on a first come first served basis which results in alerts being sent between the connectors you have set up in a random fashion.
Solution
Use a subscription connection where another Internal Connector is already in use.
Workaround
If you must use an Internal Connector we recommend removing the competing Internal Connector's subscription, or if this isn't possible, creating criteria for each connector subscription that ensures they don't compete for alerts.
There are many ways you could do this (such as filtering alerts sent based on Group or target) but, a clean way to do this is to create a new Resolution state in SCOM and to specify that only one of the Internal Connectors subscriptions sends alerts when in this state. Your SCOM team would then need to triage alerts and manually set the Resolution state you created on alerts to be sent via this connector. The result will be the alert being sent to one connector in all cases but also being sent to another connector when Resolution State is set to your newly created state.
Forwarding Status is Pending for a Long Period of Time
By default, Connection Center uses subscription connections which does not allow this condition to occur. We only recommend using Internal Connectors if you have a specific requirement that cannot be met by these subscriptions.
Problem
In the UI a forwarded alerts ‘Forwarding Status' remains as 'Forwarding Pending’ for a long period of time.
Workaround
Alerts will still be processed even though the forwarding status takes a long time to update. This can be safely ignored. If you have a corresponding Inbound Notification connection you can confirm that incidents have been created by checking synced properties or by looking at the alert history.
Alerts in Your Destination Have Different Severities/Priorities to the Console
Problem
In your Outbound Notification destination alerts are created with different severities or priorities to what the console might suggest you would receive. For example, the severity of ‘Error’ when it is shown as ‘Critical’ in the SCOM console.
Cause
The underlying SCOM SDK has alerts classified with the severity of Error instead of the Critical shown in the console. Likewise, the priority of Medium is replaced with Normal. As our ServiceNow connector pulls alerts from the SDK they get imported to ServiceNow using these values. You can see the same result if querying for alerts via the OperationsManager PowerShell module:
Get-SCOMAlert | Where-Object -Property Severity -EQ -Value 'Error'
Get-SCOMAlert | Where-Object -Property Priority -EQ -Value 'Normal'
You should bear this in mind if you are implementing incident creation logic against these fields.
The full list of Severities and Priorities is as follows:
SDK/Destination Severity | Console Severity |
|---|---|
Error | Critical |
Warning | Warning |
Information | Information |
SDK/Destination Priority | Console Priority |
|---|---|
High | High |
Normal | Medium |
Low | Low |
Using Right to Left Reading Order or Unicode Control Characters Can Cause Display Issues
Problem
Using right to left reading order or certain Unicode control characters can cause certain aspects of the SCOM console to look strange.
Cause
This issue is also present in the main areas of the SCOM console, however, it is more pronounced because of the types of data we present. URLs for example display very strangely, however, are not often seen in general SCOM use. This is purely a display issue and the underlying URL will function as expected when using Connection Center.
Overriding a Connection Manually in Scom Does Not Show in the Relevant Connection UI
Problem
When setting an override to enable/disable the connection monitors in Connection Center this does not reflect in the appropriate connection UI
Cause
Connection Center uses and sets the default values of the monitors when modifying the enabled/disabled state of the monitor. Because of this, it doesn’t take into account any overrides that may have been put in place by a SCOM user. This will still work, however, the Connection Center UI will not reflect the true state of the monitor and could be misleading. We would only recommend using our UI to enable and disable these connections.
Using the Criteria Picker Can Result in Errors
Problem
When using the criteria picker it is possible to generate errors from certain aspects of this UI. Including, but probably not limited to, using apostrophes, single quotes, or searches that do not yield any results (as would be caused by typos).
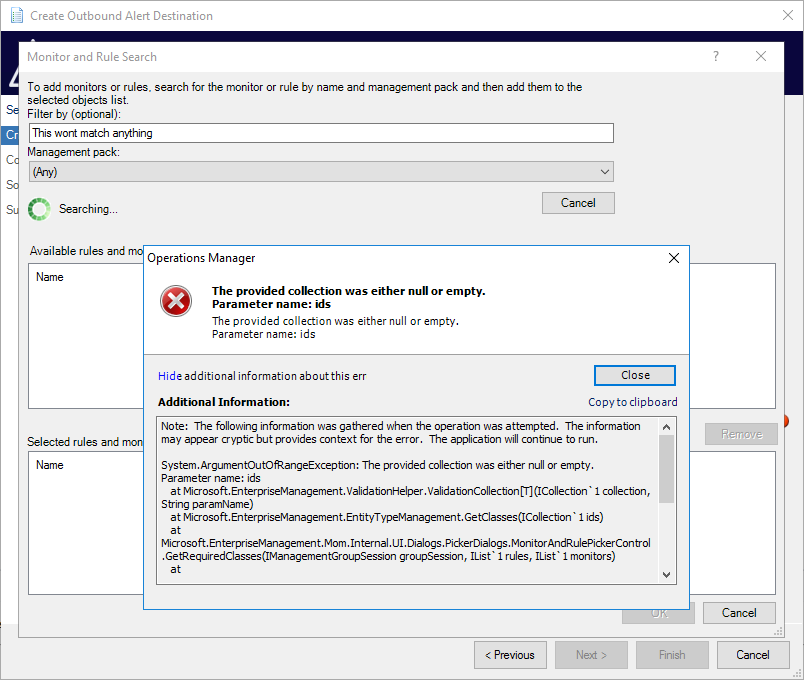
Cause
This is an underlying problem with the SCOM UI. If you were to use this criteria picker elsewhere in the console you would run into the same errors. These are non-terminating errors so you should be able to identify where things went wrong, correct them, and continue on.
You Cannot Modify the Severity or Priority of a Rule Once Created
Problem
When modifying a rule using Inbound Alert Webhooks the UI cannot be used to change the severity or the priority.
Cause
This is an underlying problem with SCOM. If you were to attempt the same thing with your own rules you would see that the severities and priorities are not changed despite the underlying configuration changing.
Workaround
Whilst you may not be able to change these properties once they are in place you can simply override them using native SCOM functionality. The other option would be to completely remove and then remake the rule (and connection) in question.
When exporting a connection based on a connector to XML it will create a connector
By default Connection Center uses Subscription based connections which are not affected
Problem
When you export a connection based on a connector to an XML file it will create the corresponding connector in the background.
Cause
In order to create a configuration, Connection center needs to generate a connector to link the configuration to. As this is not stored in a Management Pack this needs to be done upfront. Then when you import your XML MP all of the requirements are already in place and the MP will import without error. Should you need to import the MP in other Management Groups, you can use the same functionality to generate a connector using a stub MP and then simply update your existing XML to point at the new connector.
LastModified and Repeat Count Can Be out of Sync
Problem
The LastModified and Repeat Count properties can be out of sync from generated records in other services.
Cause
SCOM does not generate notifications on changes to these fields so does not provide Connection Center with any ability to hook into changes to these fields. These will be updated when more significant changes are made and SCOM sends ConnectionCenter a notification.
A Task Was Canceled
Problem
An alert is raised in your instance for one or more connections. The context for the alert is that 'A task was canceled'.
Cause
This error message indicates that some part of the process has timed out. There can be various reasons for this occurring and it will require further investigation. In our experience, this is often associated with firewalls dropping/black-holing the connection leading to a timeout.
No Events Raised by Cookdown Components
Problem
Certain components used by Connection Center use SCOM events (not to be confused with Windows Events) as part of their operation. A good example of this would be Inbound Event and Inbound Alert webhooks. In the case of Inbound Alert webhooks a symptom of this would include alerts getting raised as expected, but not being able to find previous data when modifying the connection. You may also not see any events (including heartbeats) when selecting the View Events action.
Cause
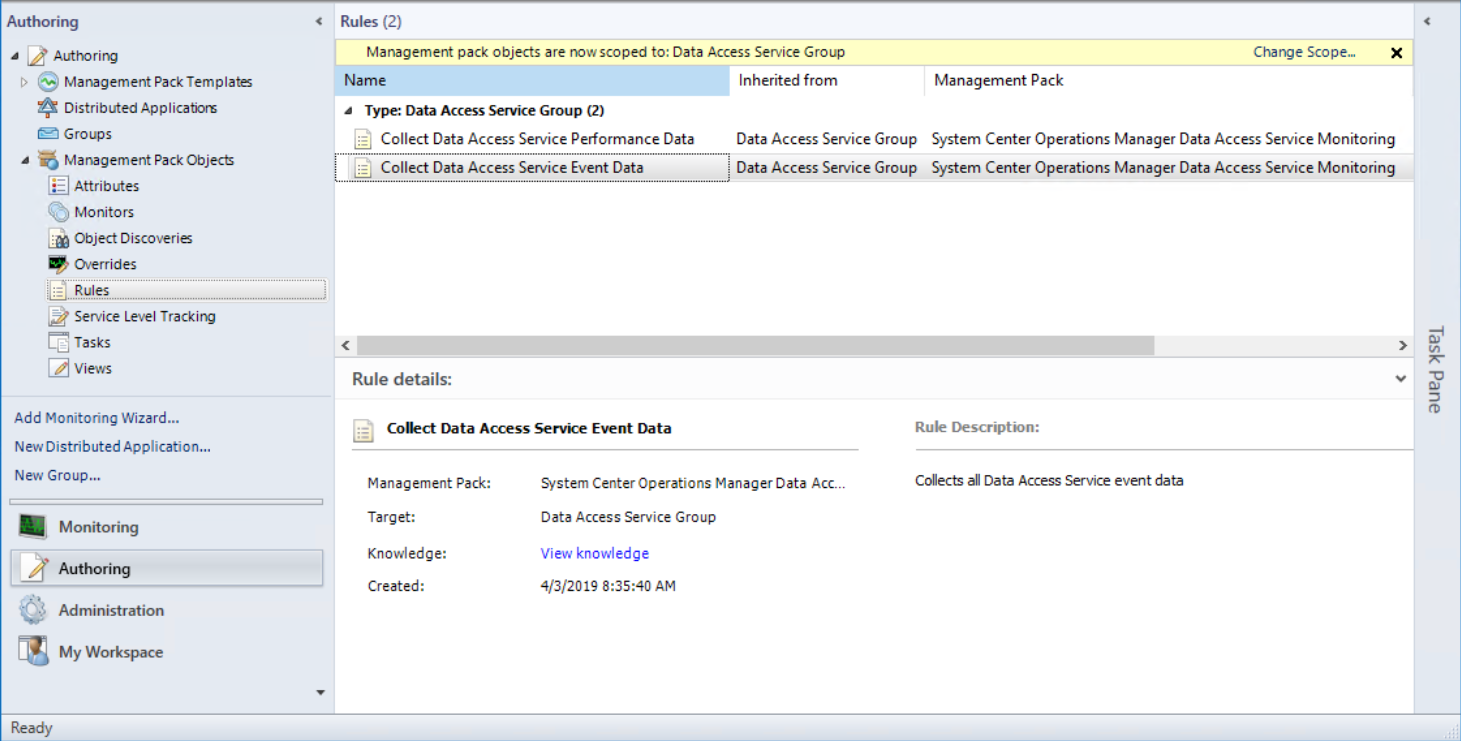
This behavior has been seen in environments that have the ‘Collect Data Access Service Event Data' rule, targeted at the 'Data Access Service Group' class, in the 'System Center Operations Manager Data Access Service Monitoring’ Management Pack disabled.
You can quickly verify if this is the case (and some useful details) using the following PowerShell:
Import-Module OperationsManager

$Rule = Get-SCOMRule -Id '5e47e99c-c42b-4de4-198f-ad801a7f6807'
$Overrides = Get-SCOMOverride -Rule $Rule

$Overrides | ForEach-Object {
    $ManagementPack = $_.GetManagementPack()

    If ($_.Context){
        $Target = Get-SCOMClass -Id $_.Context.id.Guid
    }
    else {
        $Target = Get-SCOMClassInstance -Id $_.ContextInstance.id.Guid
    }

    $_ | Select-Object -Property Id, Property, Value, Enforced, LastModified, TimeAdded, @{Name = 'ManagementPack'; expression = {$ManagementPack.Name}}, @{Name = 'ManagementPackDisplayName'; expression = {$ManagementPack.DisplayName}}, @{Name = 'TargetId'; Expression = {$Target.Id.Guid}}, @{Name = 'TargetDisplayName'; Expression = {$Target.DisplayName}}
}
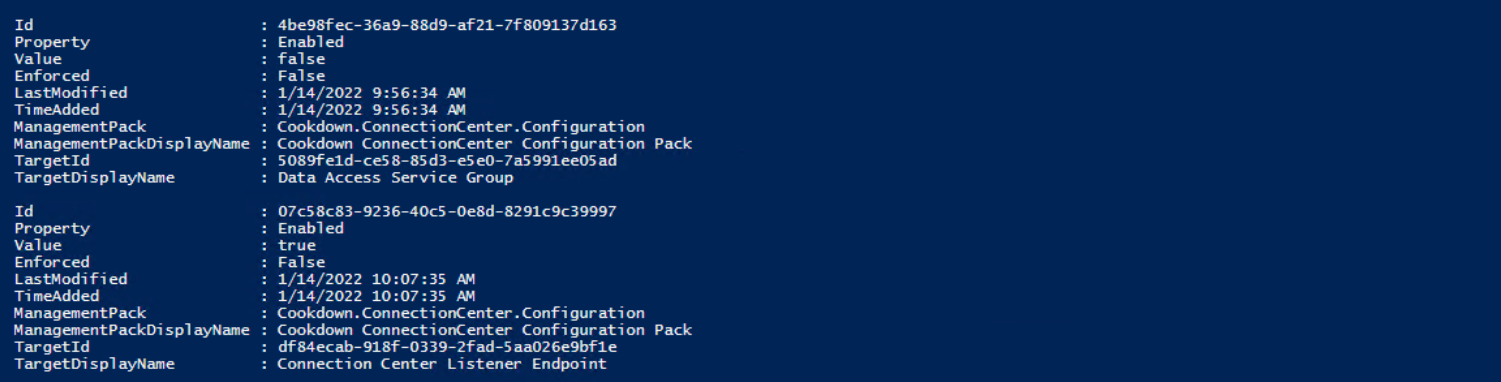
Or by looking for the overrides in the Console via the Authoring pane in the usual manner.
Resolution
Without knowing your specific reasoning for disabling this rule we would not immediately recommend removing this override. However, you can put in place a more specific override to enable this rule for the required Cookdown classes.
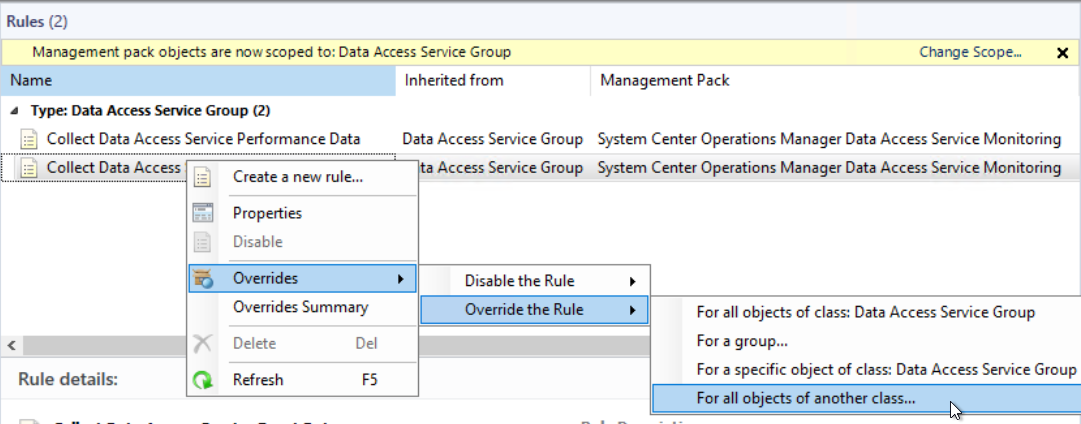
In the case of Listener Heartbeats, you would need to enable this rule for the ‘Connection Center Listener' class. In the case of Inbound Event or Alert webhooks, you would need to enable this rule for the ‘Connection Center Listener Endpoint’ class. In the case of other Inbound/Outbound connections, you would need to enable the rule for the ‘Cookdown Connection Center Hub’ parent class, or the specific hub classes that you are using.
This isn’t an exhaustive list, however, these are the most likely to be encountered at the time of writing.
Connection Center Alert Export Failure/Connection Center Alert Update Failure
Problem
After installing version 3.1.2.0 or later, you see alerts raised from Connection Center referencing Alert Export or Update Failures against a particular management server. The alert itself references a particular alert id, but if you use PowerShell to attempt to look up this ID you get no results:
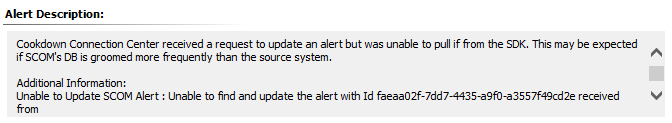

Cause
This is almost always caused by the alert being groomed out by SCOM. Check on the SCOM alerts table of ServiceNow, you will probably find that alert ID there and that it will have been created a long time ago. You may also see this behavior if your connections have been disabled or disconnected for a long period of time and Connection Center has a backlog of updates to work through.
Finally, we have seen conditions where the health of the management group, in general, has caused these. Particularly intermittent connection issues to the databases, and issues with the RMS emulator. The alert context will contain a reference to the database itself or its ability to connect to the management server.
Resolution
If you are in the former category, there’s not usually much to do. Generally, we would actually recommend that you disable these rules if you are seeing them regularly and are not required to keep them enabled for compliance reasons.
If you are in the latter category Connection Center not working correctly is more of a symptom of the problem. Restarting the health service or flushing the health service cache may get you back up and running in the short term, but the underlying issues should be investigated and corrected.
Cookdown EventLog Configuration
Problem
After installing version 3.1.2.0 or later, you see alerts raised from the Management Server HealthService with the name ‘Cookdown EventLog Configuration' and the description 'The Cookdown ConnectionCenter Event Sources on this Management Server are in the Application Log and not in the Operations Manager log. Please run the recovery to correct this issue and then perform and On Demand check to confirm the repair.’.
Cause
Connection Center on its first run on a server will attempt to register its event source under the Operations Manager event log. If it is unable to do so for whatever reason it will register itself to the Application log instead.
Resolution
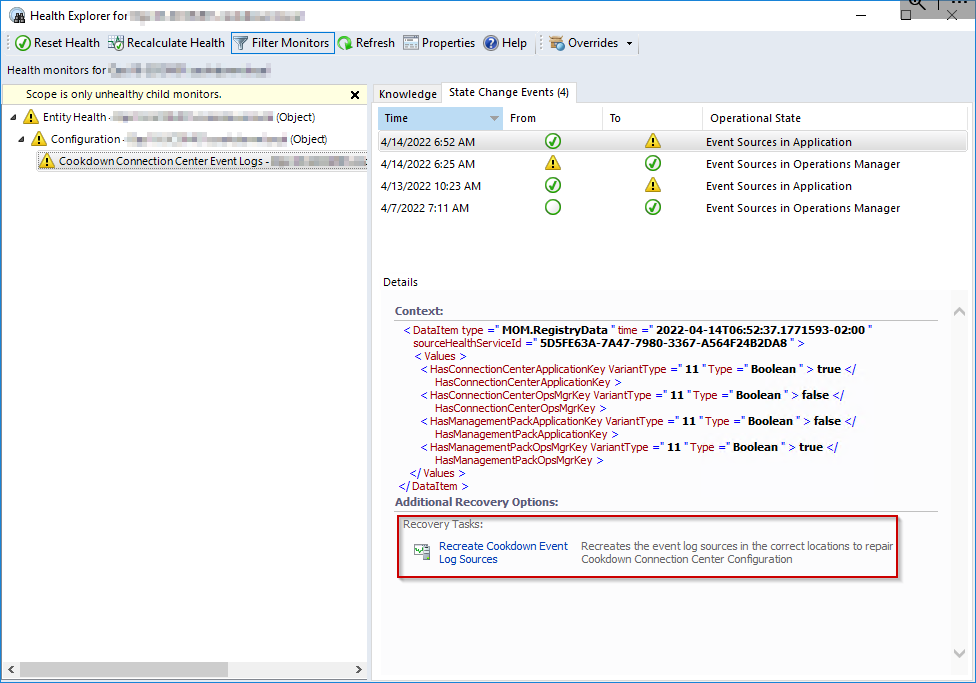
As the alert implies, there is a recovery task attached to the underlying monitor. To use this, select the alert, and then open the ‘Health Explorer' via the right-click menu or the tasks menu. Select the relevant monitor, and then ‘State Change Events’. Select the latest state change event and then the recovery task from the 'Additional Recovery Options’ section.
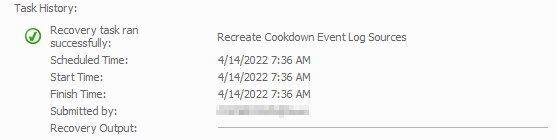
Hopefully, you will then receive the notification that this has run successfully with details about the execution time. You can then use the 'Recalculate Health' button to trigger an on-demand request to recalculate the state of the monitor.
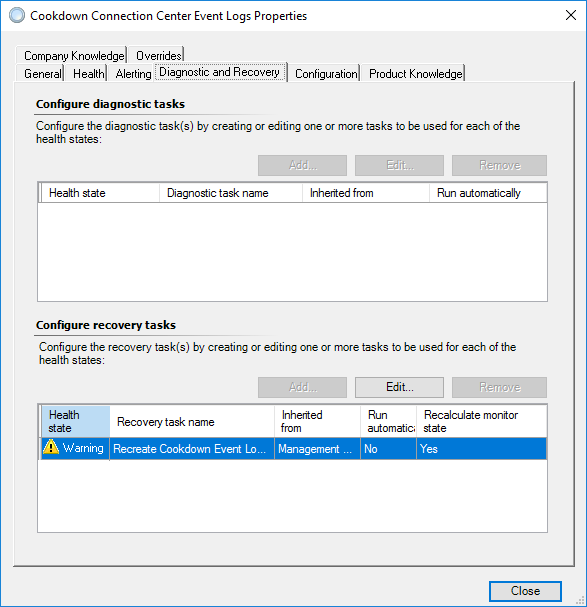
Should this recovery fail for any reason you can use the Properties button to go to the monitor and select the ‘Diagnostic and Recovery' tab to get at the recovery task. You can then double-click on the recovery task or select the ‘Edit…’ button to see the recovery details. From there select the 'Script’ tab to get at the latest version of the script.
You can then execute this script manually on any or all of the management servers affected. In the case of permissions issues, you may be required to do this where the health service is unable to do so.
Cannot set Object connection RunAs Profile independently of Notifications
Problem
There is only one ServiceNow profile, and by default this links in to both notifications and object connections. You have service accounts that do not overlap in their permissions so the connections are required to use different RunAs profiles.
Cause
Object connections are fixed to a specific RunAs profile. For technical reasons they cannot be given an alternative RunAs profile like notifications.
Workarounds
Ideally you can just create a new sealed RunAs profile (or re-purpose an unused one) and use that for your notification connections.
You can also use scoping to get around this, but this can get a bit fiddly. As the notification and object connections are hosted by the same object, you cannot use class based scoping. You can however use group/object based scoping as this is more specific than the class based scoping. We provide a group that contains Enabled connections by default. In general this is a good group to use for scoping. If you have more complex requirements you may need to create your own group for this purpose.
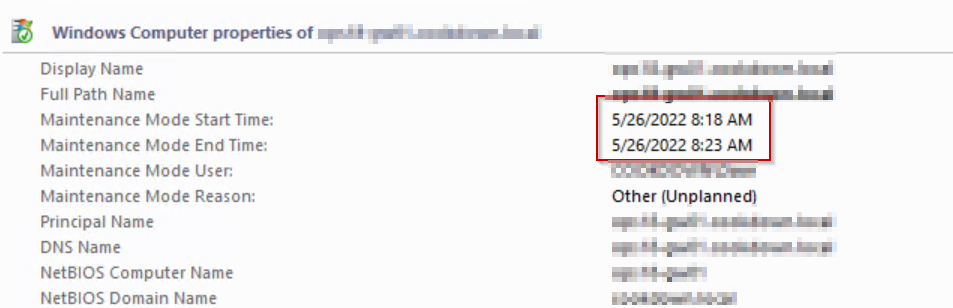
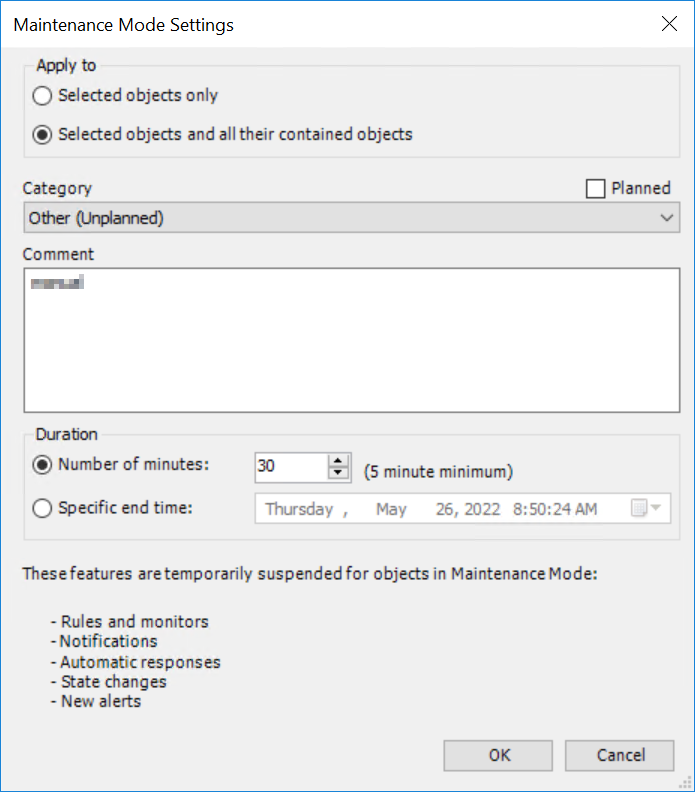
Editing a maintenance mode in the SCOM console looks like it has the wrong time
Problem
When you go to edit a maintenance mode applied by Connection Center the times don’t really match up.
Cause
The edit maintenance mode form defaults to 30 minutes regardless of the underlying maintenance:
Resetting alert monitors can cause two updates to occur
Problem
Resetting and closing an alert via Inbound Notification in SCOM can cause two updates to occur.
Cause
Since SCOM 2019 you can’t close an alert until the underlying monitor is healthy. Because of this we need to make an update to the alert and request that the monitor is reset. If the reset of the monitor causes the alert to get closed because they are tightly coupled, a second update is made.