ServiceNow Monitoring Management Pack
Current Version: 1.1.0.433
The ServiceNow Monitoring Management Pack lets you know what experience your end users have when they access ServiceNow from each of your satellite offices. Setup outside in monitoring from any existing SCOM Agent in each site you want to test from and get detailed insights such as:
Availability – ServiceNow itself is up but something between your users and ServiceNow preventing them from accessing it? get early alerts from SCOM when ServiceNow isn’t available from each site.
See how your ServiceNow site is load-balanced – We expose the servers that underpin your ServiceNow instance in SCOM, allowing you to alert on key performance metrics.
38 ServiceNow performance counters included in this management pack, such as node memory usage, logged in users, and instance load.
Setup - ServiceNow
Create an account in ServiceNow to act as a service account. This account needs to be able to access the sys_cluster_state table and the web API - permissions to the sys_cluster_state table are granted by the Admin role only by default so we recommend creating a custom ACL to grant access to this table alone. Your ServiceNow administrator will be able to set this up for you. If you are the ServiceNow administrator, the below instructions take you through the steps and require you are logged in as a system administrator
Type Users in the navbar, select Users under System Security (as per New York). Click New, give the new user a user ID and name and hit Submit
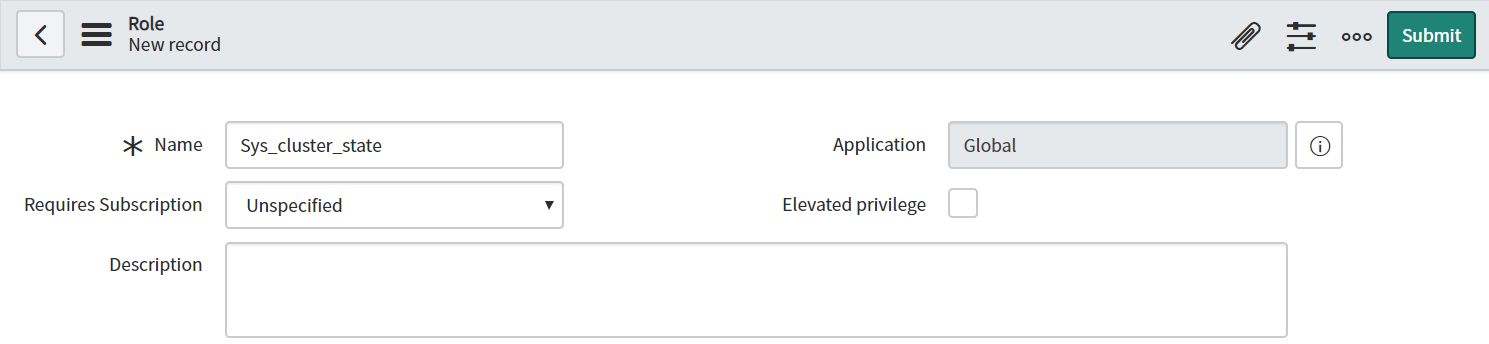
Type Roles in the navbar and select Roles under System Security and click “New”
Give the role a name and leave all other settings at the defaults:
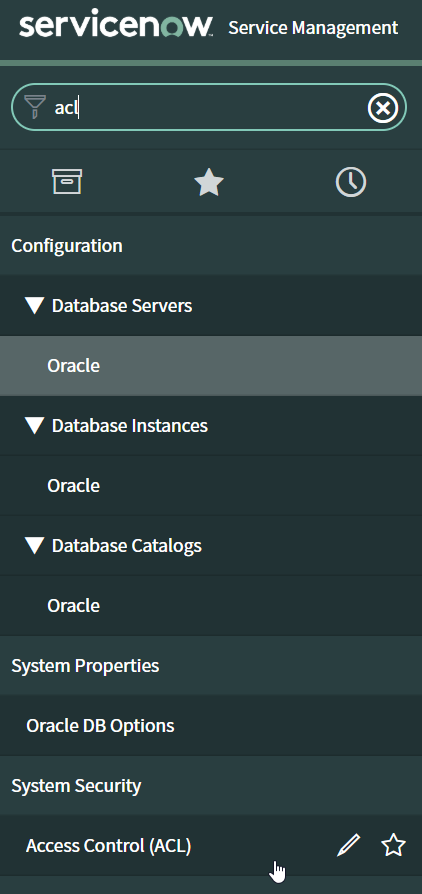
Type ACL in the navbar and select Access Control (ACL):
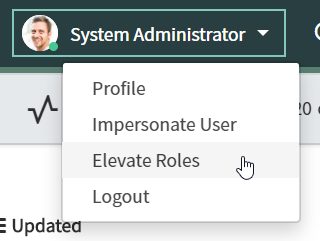
Click the down arrow in the top right corner of the screen by your profile and select “Elevate Roles”
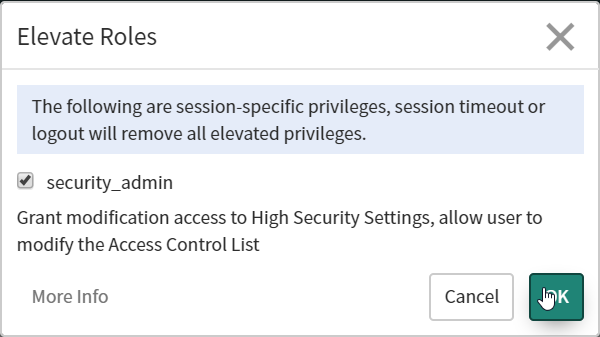
Check “security_admin” and click OK
The “New” button should now appear on the Access Controls page - click it
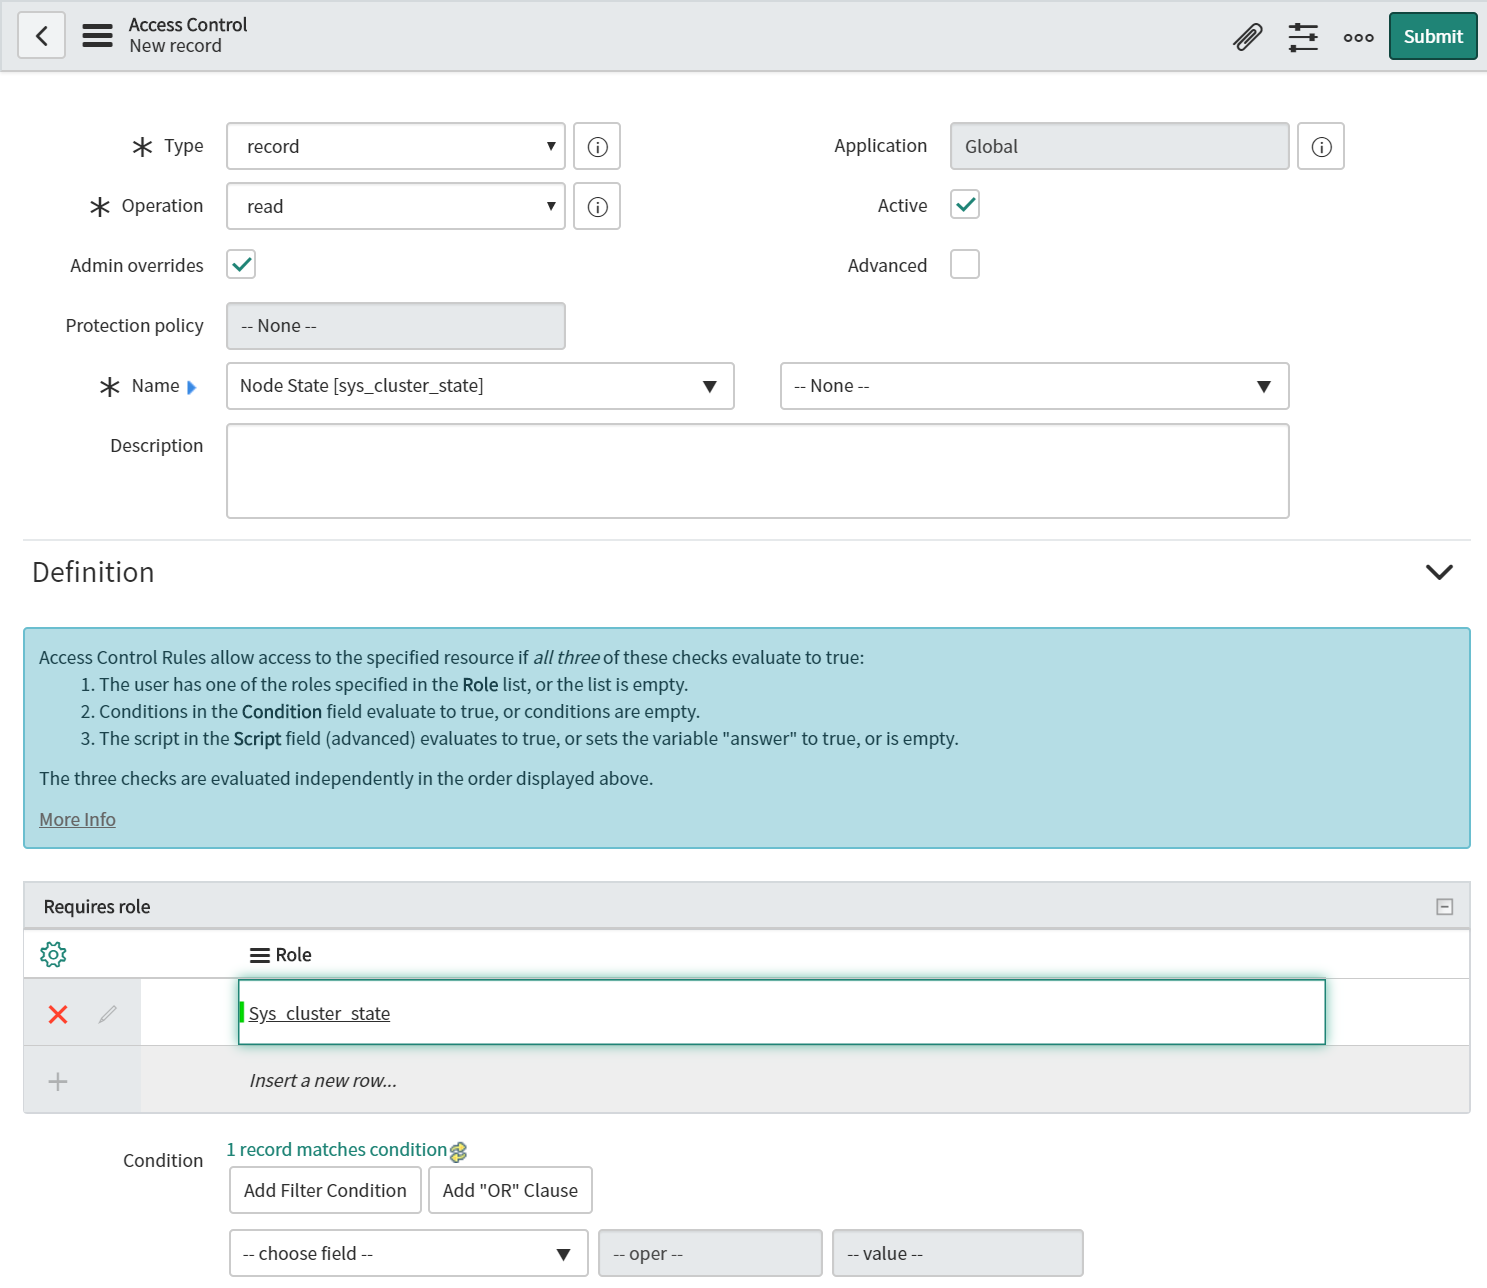
Complete the new record as per the below screenshot then click Submit then Continue. The key changes from defaults are
Operation: Read (no write/create/delete permissions are needed)
Name: sys_cluster_state (this is the table we are granting access to)
Requires role: the role you created earlier in this wizard
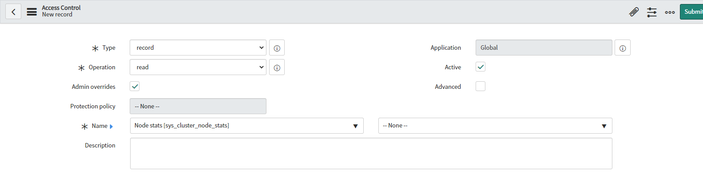
From Paris you will also need to grant access to the 'sys_cluster_node_state' table. Complete a second record as per the following screenshot and submit.
Operation: Read
Name: 'sys_cluster_node_stats'
Requires Role: The role that you created earlier
Once done search Users in the navbar and select Users under System Security
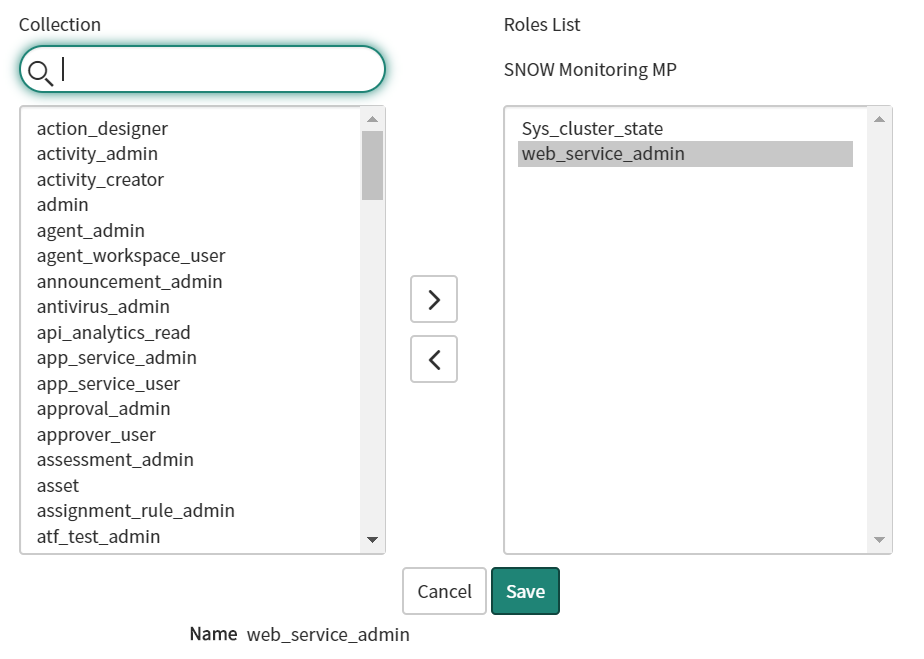
Select the user you created earlier, click the Roles tab and hit Edit
Find the web_service_admin role (which grants API access) and the custom role you just created then click Save
Setup - SCOM
Import the Management Pack (MP) as you would import any other MP following the standard Microsoft import from disk steps here.
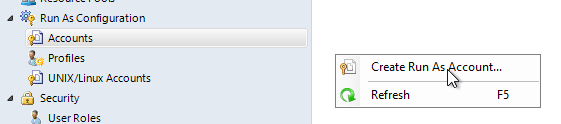
Create a Run As account in SCOM to hold the credentials of your service account. This is in the SCOM console under Administration > Run As Configuration > Accounts, where you will need to right-click and select Create Run As Account:
The Run As account type is Basic Authentication and make sure you distribute the credentials to all SCOM Management Servers (or the collection of your ServiceNow performance metrics will not work) and to the SCOM agents you plan to configure outside in monitoring to run from (aka your watchers. If you don't do this the discoveries you will configure next will not work consistently and performance metrics from each watcher won't be collected).
The MP creates a Profile that you will need to associate the credentials with. In the SCOM console navigate to Administration >Run As Configuration > Profiles and find the “Cookdown: ServiceNow Monitoring API Probe Account”:
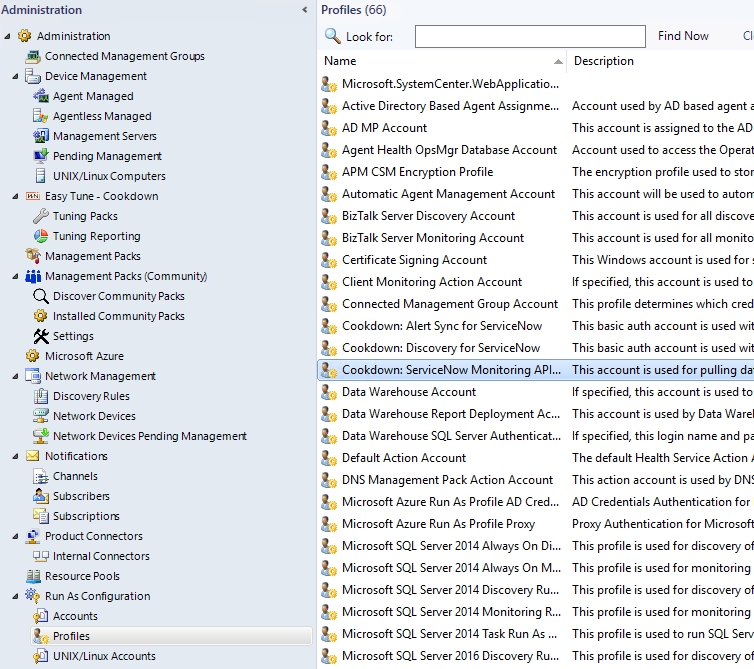
right-click the profile, select properties. Click through the wizard until you get to the Run As Accounts page. On this page click Add and find the Run As account you just created in SCOM
Complete the wizard
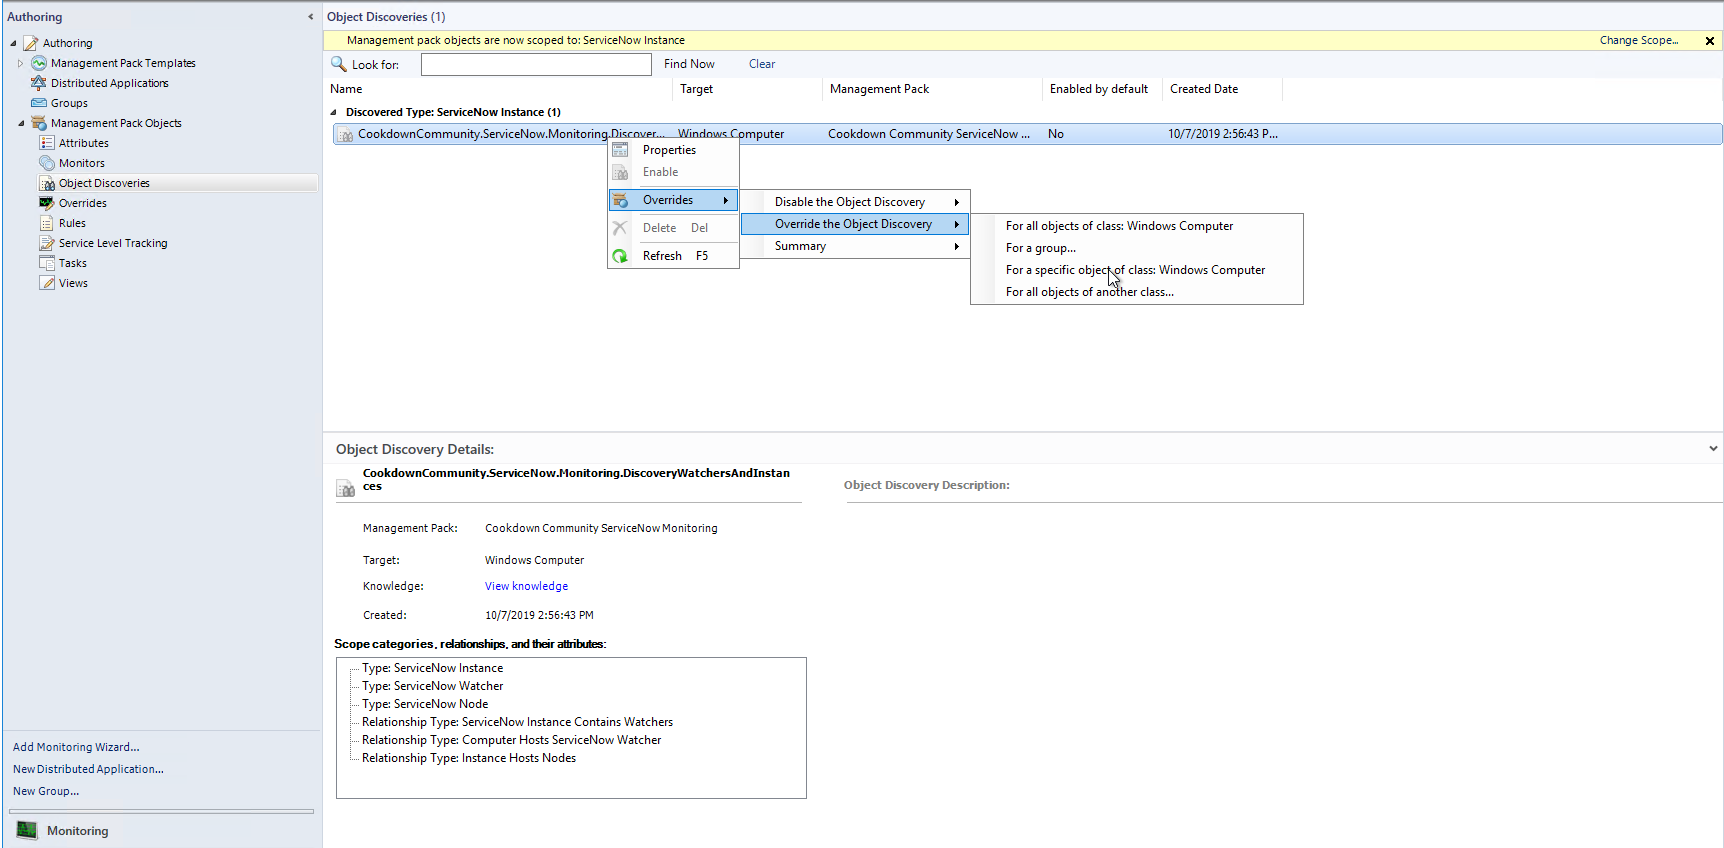
The discoveries that find your ServiceNow instance are disabled by default. To enable them in the SCOM Console, navigate to Authoring > Management Pack Objects > Object Discoveries
Change the scope of the view to “ServiceNow Instance”
Override the (disabled by default) discovery shown for any Windows Computer you want to monitor your ServiceNow instance from by picking the specific objects from the Windows Computer class:
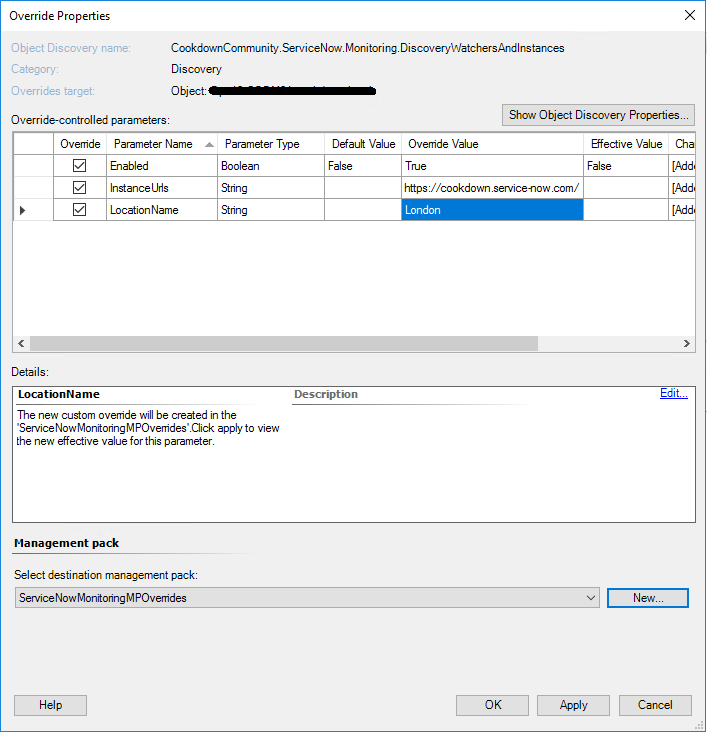
When you have selected the specific Windows Computer to monitor for you are shown the three parameters of our discovery, Fill these in and save your override to enable ServiceNow instance discovery:
Enabled - controls whether our discovery is enabled or disabled
InstanceUrls - contains the ServiceNow URLs you wish to monitor. This field accepts a comma-separated list of instance URLs. Each instance should be followed by a “/” for it to be recognized (for example “https://mycompanyservicenowinstance.service-now.com/”)
LocationName - the friendly name that is shown in the UI for the watcher created for this location
Repeat the previous step from all Windows Computer you expect the discovery to run from (your remote sites)
The result of the discovery is a Distributed Application (DA) that looks like the below:

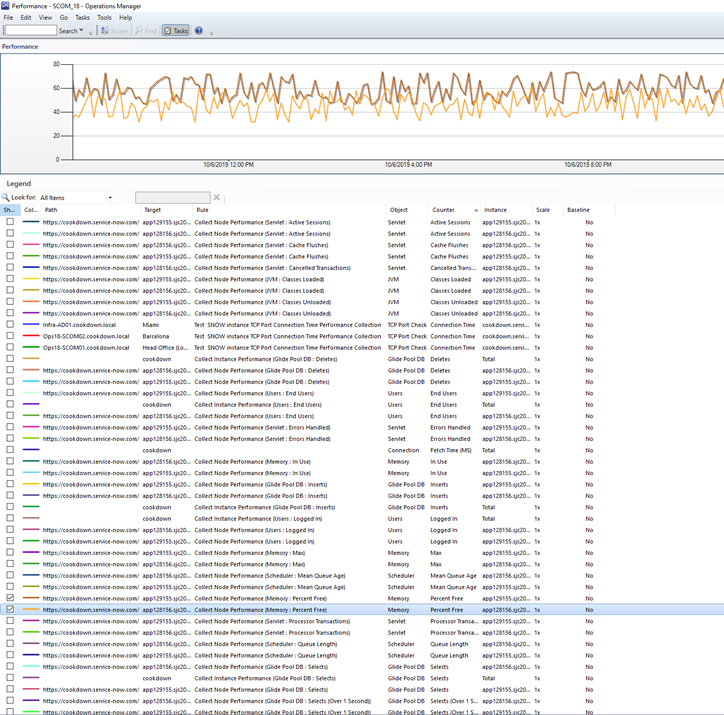
The MP should collect performance metrics from your ServiceNow instance’s nodes also
Once Setup
When the SCOM MP has been imported and the needed overrides have been created, SCOM will discover your ServiceNow instance, nodes and will expose key performance counters.
Default Views
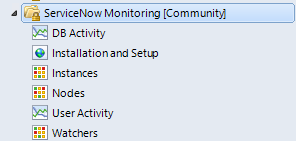
Out of the box, the above views are added to SCOM.
Watcher monitoring configuration
By default, the below monitors are created for each watcher (machines you have set up to monitor ServiceNow) you define through overrides:
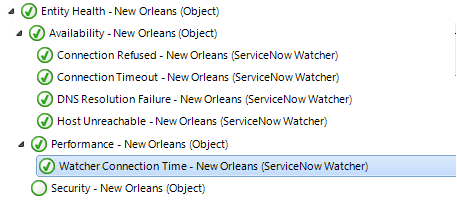
There are many configurable settings here which you are free to override and understand. At a high level:
Availability
Connection Refused - Monitors from the watcher when its connection to ServiceNow is actively refused. Usually indicated authentication issues.
Connection Timeout - The connection from the watcher to ServiceNow timing out indicates a connectivity issue between the watcher and ServiceNow. If intermittent this could indicate a performance issue, networking issue or ServiceNow outage.
DNS Resolution Failure - The ServiceNow instance URL provided isn't resolving to an IP address so the watcher cannot connect to it. Usually indicates a mistyped URL (remember the URL needs to end with a forward slash - https://myinstance.service-now.com/) or DNS issues.
Host Unreachable - Your ServiceNow instance is unreachable. Usually indicates connectivity issues or ServiceNow timeouts.
Performance
Watcher Connection Time - Monitors round trip latency between your watcher and ServiceNow instance. Issues indicate network issues usually and will mean a poor user experience for users located where your watcher is when using ServiceNow, but not an outage. More details on how the properties of this monitor work are detailed below:
Watcher Connection Time Monitor - New from 1.1.0.413
The Performance Monitor is configured to show you when the round trip latency between your watcher and ServiceNow becomes unacceptable. A warning state is shown when over 150ms and the monitor turns critical when over 300ms latency.
By default, no alerts will be raised by this monitor.
As with lots in SCOM, these defaults are configurable by overrides. To override the defaults, navigate to Monitoring > ServiceNow Monitoring [Community] > Watchers > select the watcher you want to override the defaults for > Health Explorer > take off the default filter > Performance > Watcher Connection Time > Overrides > Override the Monitor > For the object: <name of selected watcher>
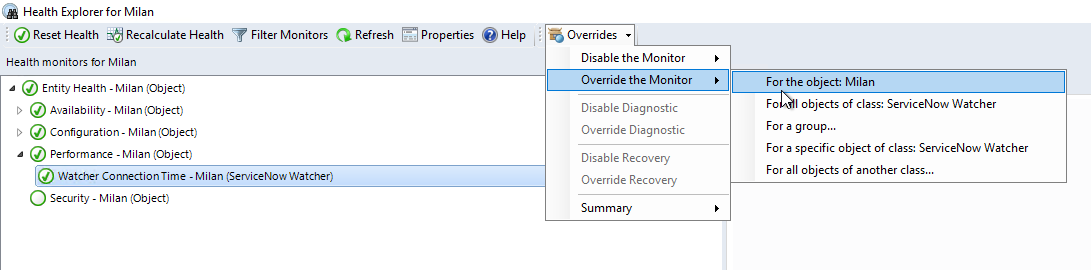
Our watcher for this screenshot is called “Milan”. You will see the default values:
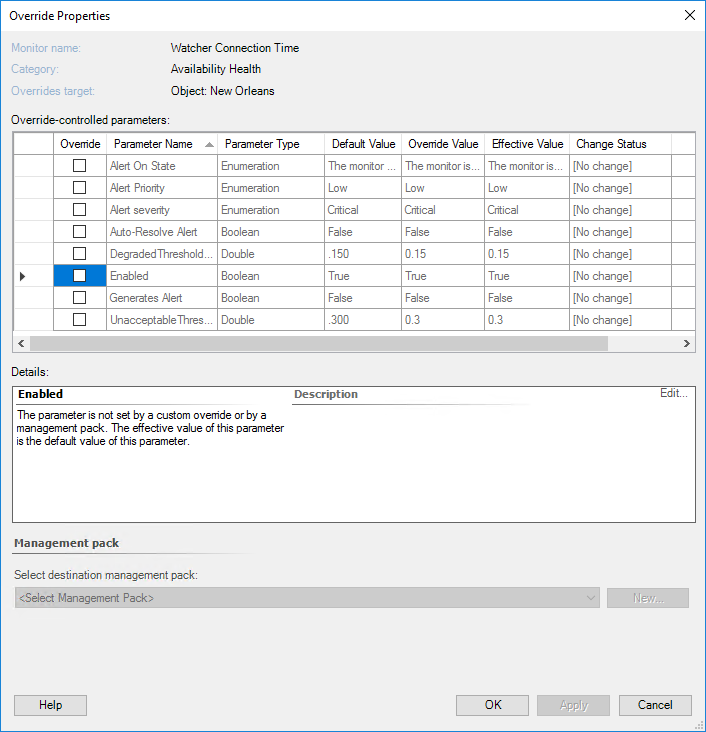
The overridable parameters are:
Alert On State - whether this monitor raises an alert when the monitor is in Critical state or whether it alerts on Critical and Warning states.
Default: Critical State
Note no Alert is raised unless “Generated Alert” is also set to True (its default is False)
Alert Priority - the priority of alerts raised from this monitor when alerts are enabled
Default: Low
Alert severity - the severity of alerts raised from this monitor when alerts are enabled
Default: Critical
Auto-Resolve Alert - whether alerts resulting from this monitor are auto-resolved when the monitor changes state (EG goes from Critical to Warning)
Default: False
DegradedThreshold - the round trip latency threshold between the watcher and ServiceNow
Default: 0.150 (150 ms)
Enabled - is this monitor enabled at all
Default: True
Generates Alert - do Warning and/or Critical health from this monitor result in alerts being raised in SCOM
Default: False
UnacceptableThreshold - the round trip latency threshold between the watcher and ServiceNow
Default: 0.150 (150 ms)
Support
This is a free community management pack so it is made available “as is” and is provided without support. The source code is made available on GitHub here: https://github.com/cookdown/ServiceNow-Monitoring-MP
If you have a technical question please raise an issue against the GitHub repository or use community.squaredup.com
Known Issues
ServiceNow watchers not discovered & an error is thrown to the event log
Issue: I see the below error thrown to the event log and no ServiceNow watchers are discovered once I have the MP setup
Solution: This issue is caused by the ServiceNow service account you are using not having permissions to the “sys_cluster_state” table. Please grant the account permissions to this table to prevent this issue
Event Log error:
Failed to run the PowerShell script due to the exception below, this workflow will be unloaded.
System.Reflection.TargetInvocationException: Exception has been thrown by the target of an invocation. ---> System.Reflection.TargetInvocationException: Exception has been thrown by the target of an invocation. ---> Microsoft.EnterpriseManagement.HealthService.MalformedDataItemException: Exception has been thrown by the target of an invocation. ---> System.Reflection.TargetInvocationException: Exception has been thrown by the target of an invocation. ---> System.FormatException: Unrecognized Guid format.
at System.Guid.GuidResult.SetFailure(ParseFailureKind failure, String failureMessageID, Object failureMessageFormatArgument, String failureArgumentName, Exception innerException)
at System.Guid.TryParseGuid(String g, GuidStyles flags, GuidResult& result)
at System.Guid..ctor(String g)
at Microsoft.EnterpriseManagement.Modules.DataItems.Discovery.RelationshipInstance..ctor(XmlReader reader)
--- End of inner exception stack trace ---
at System.RuntimeMethodHandle.InvokeMethod(Object target, Object[] arguments, Signature sig, Boolean constructor)
at System.Reflection.RuntimeConstructorInfo.Invoke(BindingFlags invokeAttr, Binder binder, Object[] parameters, CultureInfo culture)
at Microsoft.EnterpriseManagement.Mom.Internal.Xml.XmlReaderHelper.ReadElementAsItem[TItemType](String itemName)
at Microsoft.EnterpriseManagement.Mom.Internal.Xml.XmlReaderHelper.ReadElementsAsArray[TItemType](String itemName)
at Microsoft.EnterpriseManagement.Mom.Internal.Xml.XmlReaderHelper.ReadContainerElementAsArray[TItemType](String containerName, String itemName)
at Microsoft.EnterpriseManagement.Modules.DataItems.Discovery.DiscoveryDataItem.InitializeExtendedDataFromXml(XmlReader reader)
at Microsoft.EnterpriseManagement.Modules.DataItems.Discovery.DiscoveryDataItem..ctor(XmlReader reader)
--- End of inner exception stack trace ---
at Microsoft.EnterpriseManagement.Modules.DataItems.Discovery.DiscoveryDataItem..ctor(XmlReader reader)
--- End of inner exception stack trace ---
at System.RuntimeMethodHandle.InvokeMethod(Object target, Object[] arguments, Signature sig, Boolean constructor)
at System.Reflection.RuntimeConstructorInfo.Invoke(BindingFlags invokeAttr, Binder binder, Object[] parameters, CultureInfo culture)
at Microsoft.EnterpriseManagement.HealthService.DataItemBase.CreateDataItemFromXml(ConstructorInfo dataItemConstructor, String itemXml)
at Microsoft.EnterpriseManagement.Modules.PowerShell.PipelineResults.GetDataItemFromOutput(PowerShellOutputType outputType, Int32 serializationDepth, Collection`1 output, String scriptOutput)
at Microsoft.EnterpriseManagement.Modules.PowerShell.PipelineResults..ctor(PowerShellOutputType outputType, Int32 serializationDepth, Exception scriptException, PipelineState pipelineState, Collection`1 output, String scriptOutput)
--- End of inner exception stack trace ---
at System.RuntimeMethodHandle.InvokeMethod(Object target, Object[] arguments, Signature sig, Boolean constructor)
at System.Reflection.RuntimeConstructorInfo.Invoke(BindingFlags invokeAttr, Binder binder, Object[] parameters, CultureInfo culture)
at Microsoft.EnterpriseManagement.Common.PowerShell.RunspaceController.GetDataFromOutput[T](Object[] constructorArgs, Exception scriptException, PipelineState pipelineState, Collection`1 output, String scriptOutput)
at Microsoft.EnterpriseManagement.Common.PowerShell.RunspaceController.RunScript[T](String scriptName, String scriptBody, Dictionary`2 parameters, Object[] constructorArgs, IScriptDebug iScriptDebug, Boolean bSerializeOutput)
at Microsoft.EnterpriseManagement.Modules.PowerShell.PowerShellProbeActionModule.RunScript(RunspaceController runspaceController)
Script Name: DiscoverServiceNowMonitoring.ps1
One or more workflows were affected by this.
Workflow name: CookdownCommunity.ServiceNow.Monitoring.DiscoveryWatchersAndInstances
Instance name: cookdown.service-now.com
Instance ID: {57CEB508-8DA8-15F1-97A7-39267A82}
Management group: SCOM_12
Issue: I see the below error thrown to the event log and no ServiceNow watchers are discovered once I have the MP set up.
Solution: Starting in Paris ServiceNow has moved some of the key metrics and properties to a second table. Support for Paris was added in version 1.1.0.433. Ensure that you are at least at this version when attempting to discover a Paris based instance.
Event Log Error:
Cookdown SNOW Discovery : Discovery Failed with error You cannot call a method on a null-valued expression.
Discovery was trying to process <Your URL>
Issue: I see the below error thrown to the event log and no ServiceNow watchers are discovered once I have the MP set up.
Solution: Ensure that the service account created has the correct permissions to access the required table(s). You may wish to temporarily try giving the account the admin role for troubleshooting purposes.
Cookdown SNOW Discovery : Discovery Failed with error The remote server returned an error: (401) Unauthorized.
Issue: I see the below error thrown to the event log and no ServiceNow watchers are discovered once I have the MP set up.
Solution: Ensure that the service account created has the correct permissions to access the sys_cluster_node_state table. ServiceNow sometimes replaces 403 errors with 404 errors for security reasons. You may wish to temporarily try giving the account the admin role for troubleshooting purposes.
Cookdown SNOW Discovery : Discovery Failed with error The remote server returned an error: (404) Not Found.